Chicago baseball
League
A little-more-than-casual but not-very-wonky statistical look at the regular season
Best viewed with a mobile device on a warm evening, sitting in a cheap upper-deck seat with family, friends, a ballpark hot dog and your favorite cold beverage. Dang, can't wait to do that again.
Updated Wednesday, June 7, at 10:32 a.m.
Standings
JUMP TO TOP | VISUALIZATIONS
Pybaseball gathers these from Baseball-reference.com. Standings are not always updated by the time this page is, and may be slightly out of date.
American League
East Division
| Team | Wins | Loses | W-L % | GB |
|---|---|---|---|---|
| TBR | 44 | 19 | .698 | -- |
| BAL | 37 | 23 | .617 | 5.5 |
| NYY | 36 | 26 | .581 | 7.5 |
| TOR | 34 | 28 | .548 | 9.5 |
| BOS | 31 | 30 | .508 | 12.0 |
Central Division
| Team | Wins | Loses | W-L % | GB |
|---|---|---|---|---|
| MIN | 31 | 30 | .508 | -- |
| CLE | 27 | 33 | .450 | 3.5 |
| DET | 26 | 33 | .441 | 4.0 |
| CHW | 27 | 35 | .435 | 4.5 |
| KCR | 18 | 43 | .295 | 13.0 |
West Division
| Team | Wins | Loses | W-L % | GB |
|---|---|---|---|---|
| TEX | 40 | 20 | .667 | -- |
| HOU | 36 | 25 | .590 | 4.5 |
| LAA | 32 | 30 | .516 | 9.0 |
| SEA | 30 | 30 | .500 | 10.0 |
| OAK | 13 | 50 | .206 | 28.5 |
National League
East Division
| Team | Wins | Loses | W-L % | GB |
|---|---|---|---|---|
| ATL | 36 | 24 | .600 | -- |
| MIA | 34 | 28 | .548 | 3.0 |
| NYM | 30 | 31 | .492 | 6.5 |
| PHI | 29 | 32 | .475 | 7.5 |
| WSN | 25 | 35 | .417 | 11.0 |
Central Division
| Team | Wins | Loses | W-L % | GB |
|---|---|---|---|---|
| MIL | 33 | 28 | .541 | -- |
| PIT | 32 | 28 | .533 | 0.5 |
| CIN | 28 | 33 | .459 | 5.0 |
| CHC | 26 | 34 | .433 | 6.5 |
| STL | 25 | 37 | .403 | 8.5 |
West Division
| Team | Wins | Loses | W-L % | GB |
|---|---|---|---|---|
| ARI | 36 | 25 | .590 | -- |
| LAD | 35 | 26 | .574 | 1.0 |
| SFG | 30 | 30 | .500 | 5.5 |
| SDP | 28 | 33 | .459 | 8.0 |
| COL | 26 | 36 | .419 | 10.5 |
Visualizations
Pybaseball gets these statistics from fangraphs.com. I'm using Seaborn, a Python visualization library, to create the charts. Seaborn is inspired by ggplot2 in R.
As far as how I decide what and how I chart, I'm using the highly sophisticated method of "Well that sounds important, I wonder what it would look like if I chart it with this other thing that sounds important." A high bar indeed.
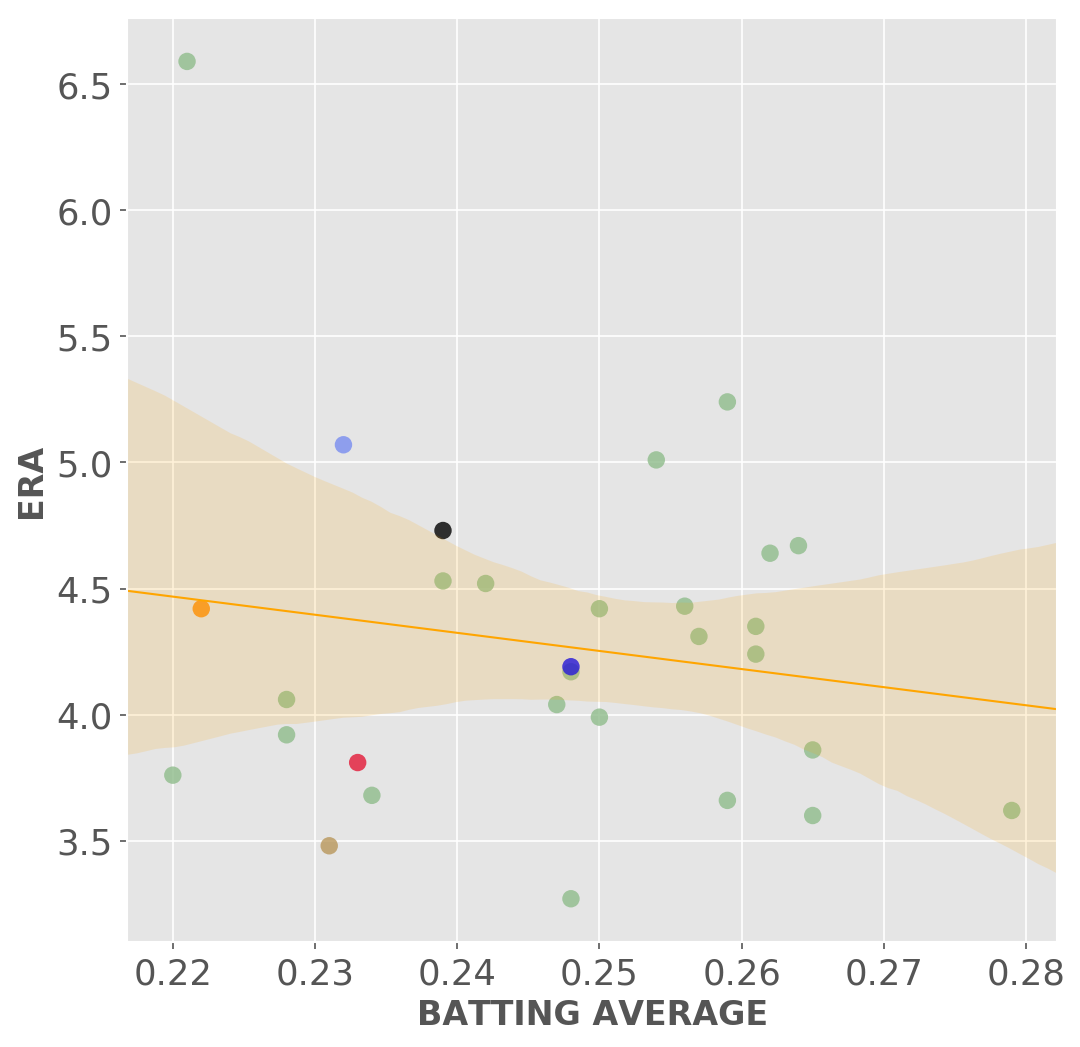
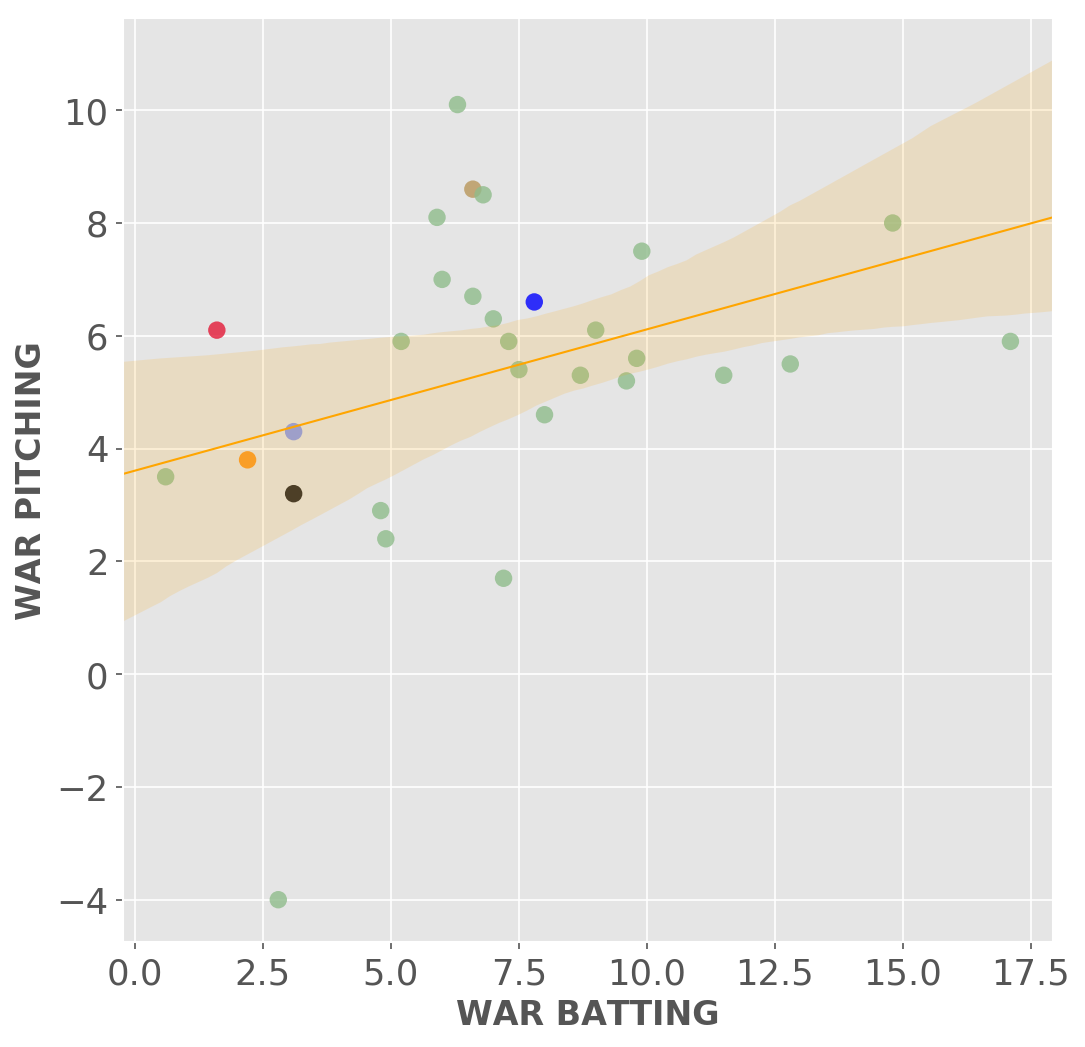
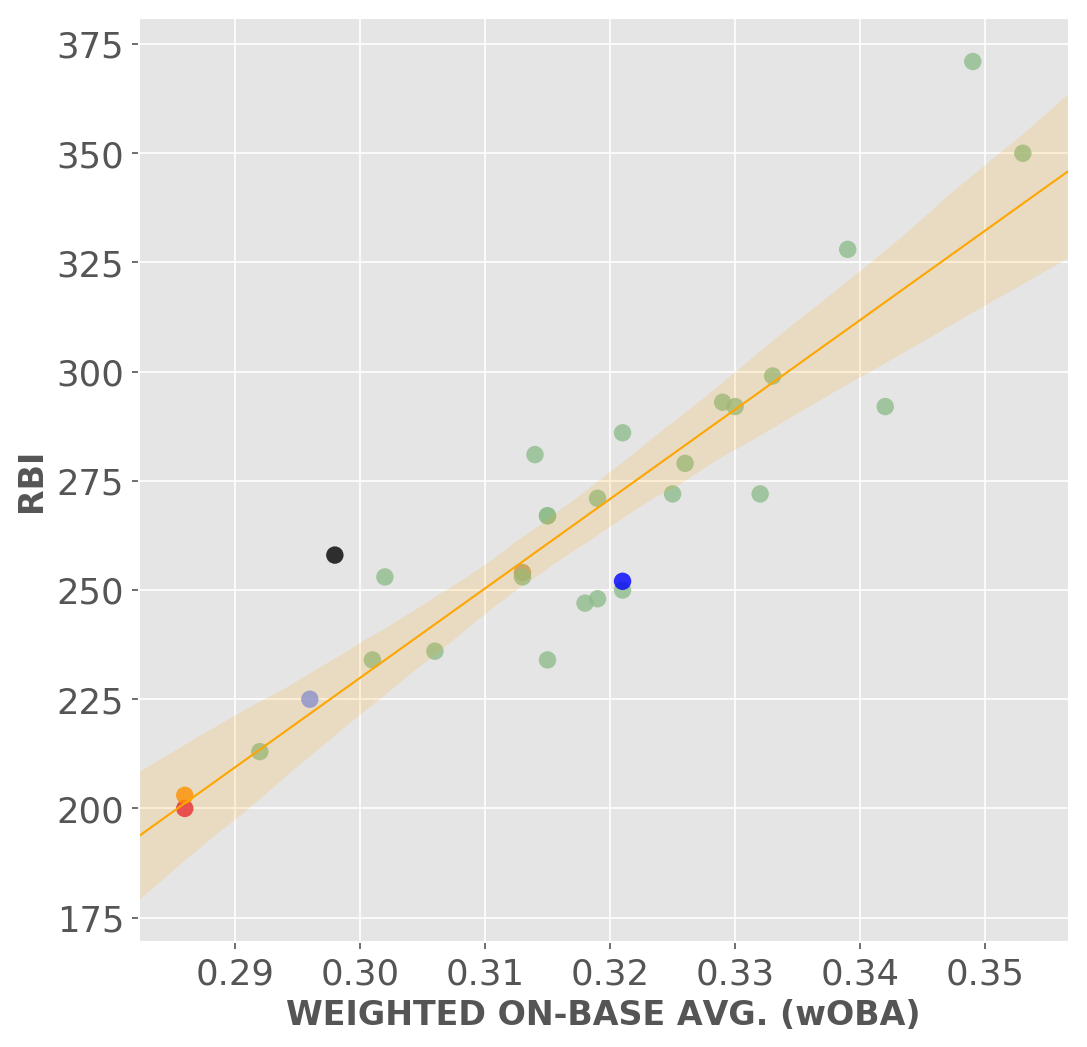
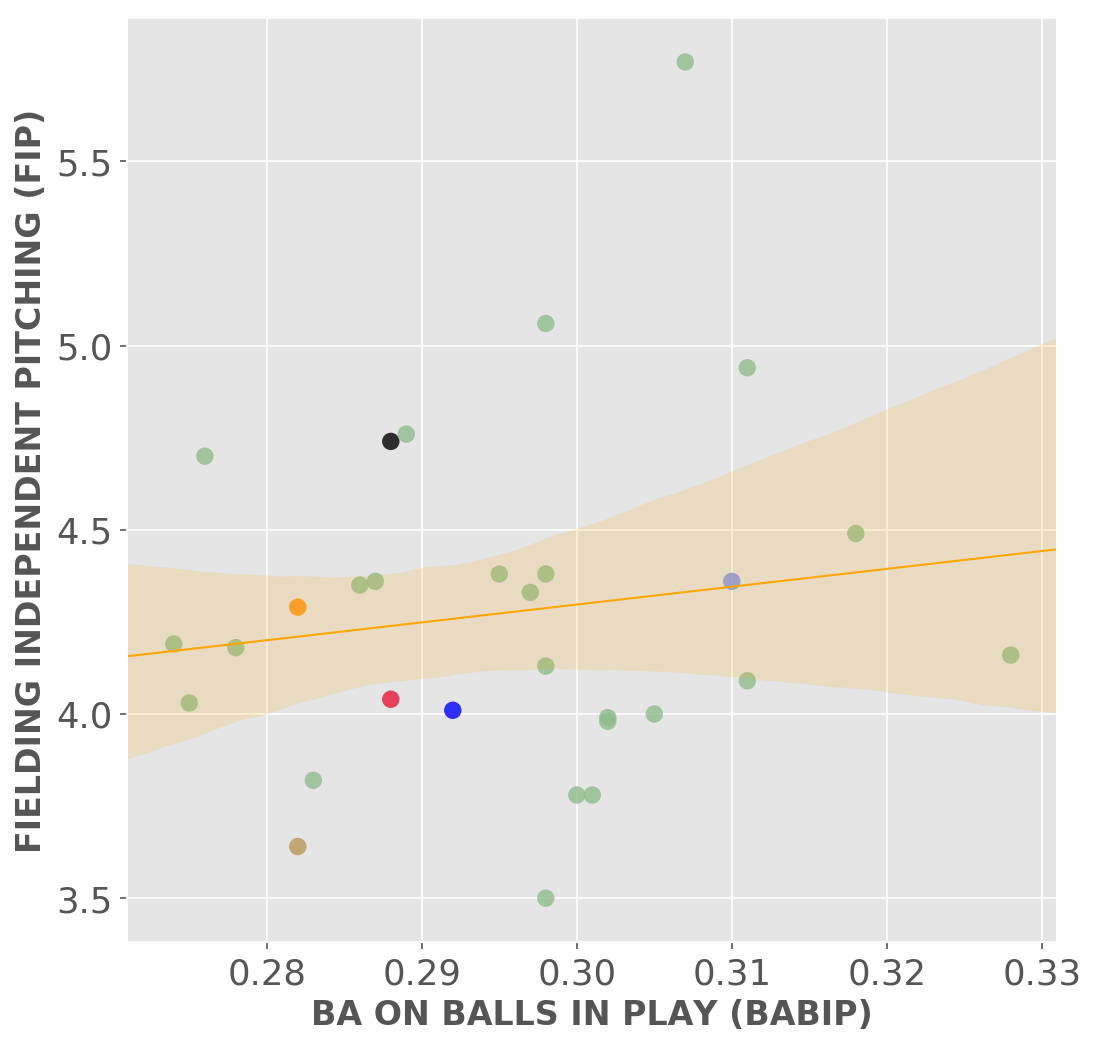
Black = White Sox, Blue = Cubs, Light Blue = KCR, Red = Cleveland, Dirty Gold = Twins, Orange = Detroit.
Batting average versus Earned Run Average
The classic statistics - a high batting average and a low ERA should mean a successful team.
The closer to the lower right-hand corner the better.
WAR batting and pitching
Fangraphs describes Wins Above Replacement or WAR as the average number of wins a player is worth compared to what you'd get from an average replacement player. The higher the WAR number, the more valuable a player is. The team number is the sum of all WAR stats for each individual player. That means, like with mean (or average) a player with a very high or very low WAR value could skew the total some. Check out the distribution plots on the h2h page for more.
The closer to the upper right-hand corner the better.
Weighted On-Base Average and RBIs
Weighted On-Base Average combines batting average, on-base percentage, and slugging percentage, "weighting each of them in proportion to their actual run value" according to fangraphs.com.
So these two measures should give us a pretty good idea of offensive production, if we think if it in terms of "get 'em on, get 'em over, get 'em in."
The closer to the upper right-hand corner the better.
FIP and BABIP
Batting Average on Balls In Play (BABIP) measures average batting average allowed based on how often a ball in play goes for a hit. Balls in play don't include home runs. So if the pitcher is giving up a lot of hits their defense can't handle, or if you have a third baseman who doesn't make those tougher plays, the BABIP is higher.
FIP or Fielding Independent Pitching tries to show a pitcher's ERA correcting for the performance of the fielding around them. According to fangraphs, FIP looks at "their strikeouts, walks, hit batters, and home runs while assuming average luck on balls in play."
With both these measures, the lower the better or closest to the lower left-hand corner.
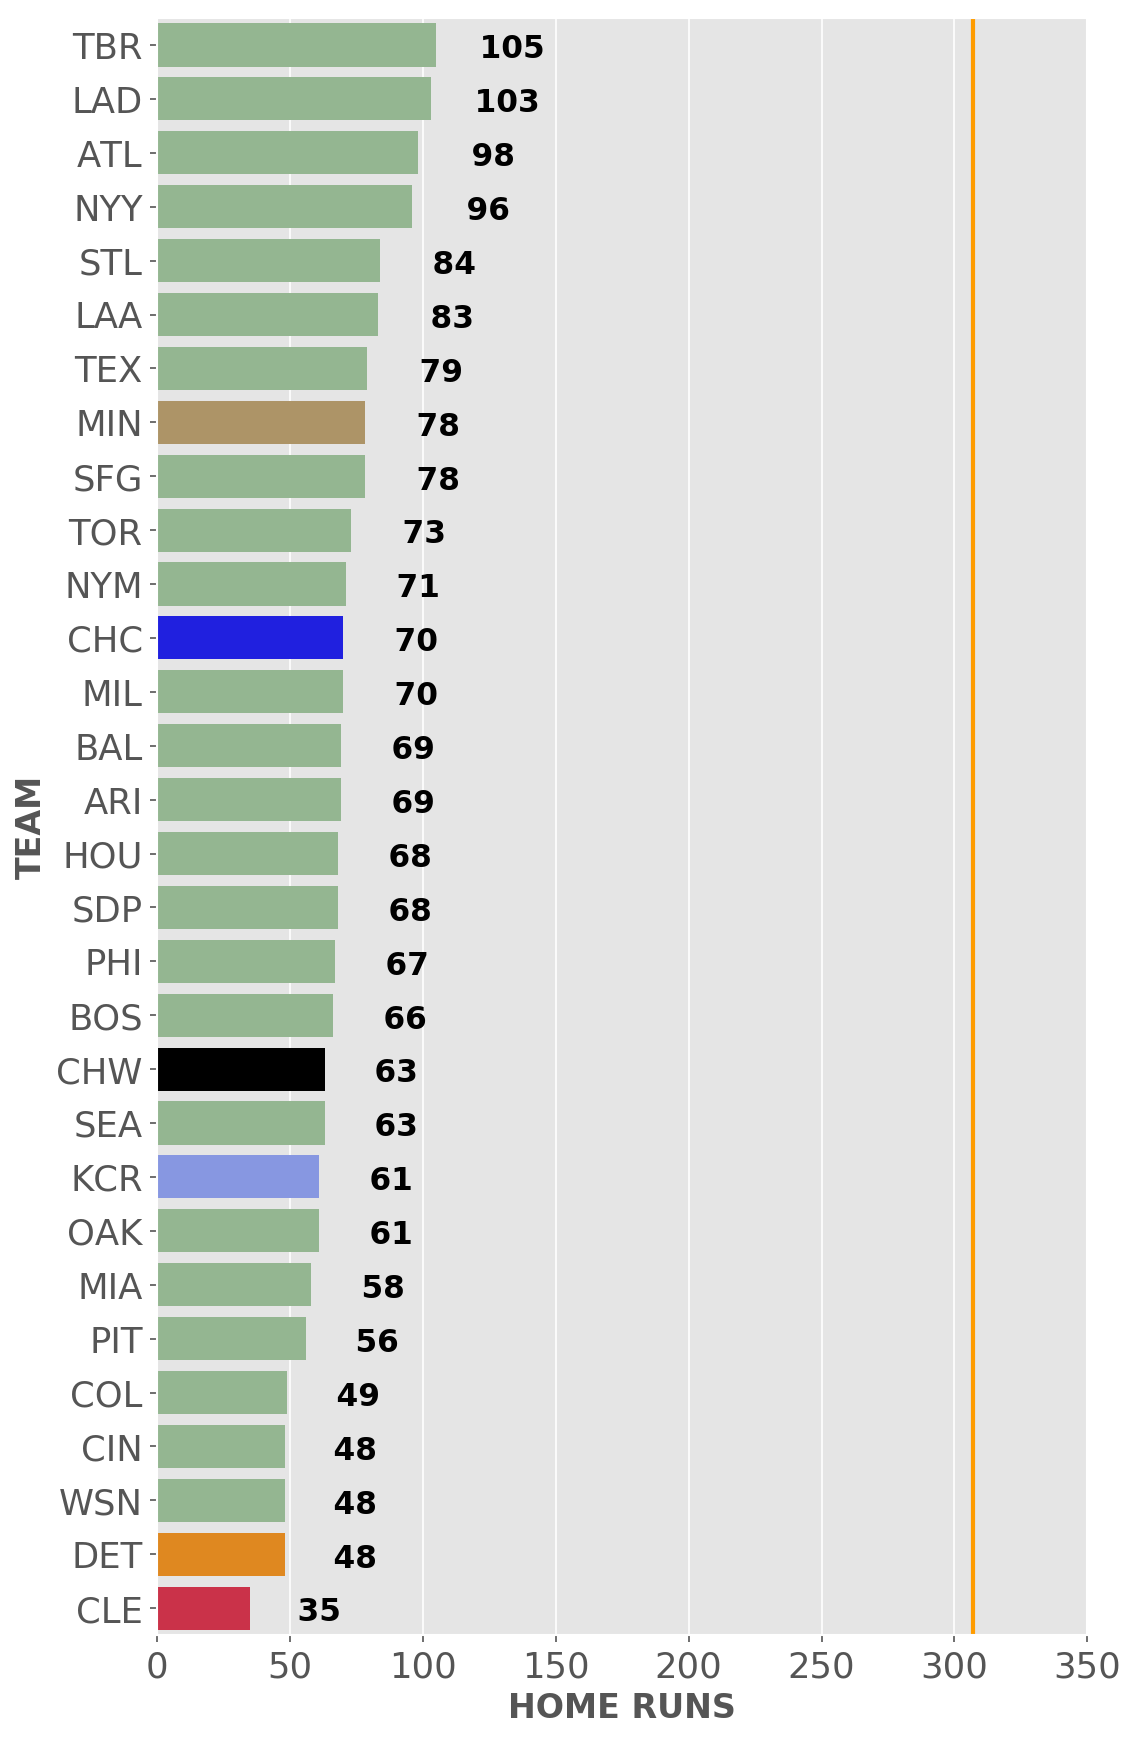
Team home runs
The Twins hit 307 homers in 2019, surpassing a record the Yankees set in the previous season. Let's see if that holds up. The vertical orange line indicates the current record.
JUMP TO TOP